A temperature-compensated system
The cyanobacteria (blue-green "algae") are the simplest organisms to exhibit circadian rhythms. As in other organisms, light triggers an oscillation with a period around 24 hours in the transcription and translation of certain genes. Observations by Xu et al. (2000) on the cyanobacterium Synechococus elongatus indicate that the clock mechanism continues to oscillate even when the cells are transferred to the dark, which inhibits almost all transcription.
Oscillations of the messenger RNAs for the proteins, KaiA, KaiB, and KaiC occur during continous light exposure and mutations in any of these genes abolishes the circadian rhythm. When cells were exposed to light for 12 hours, by which time the concentration of Kai messenger RNAs had reached a peak, then placed in the dark for various times (2-42 hours) before returning to the light, when the mRNA oscillation resumed it had the same phase as for the cells that were continullay in the light. For example, the peaks in mRNA concentration occurred around 36 (if the light was restored before), 60, or 84 hours.
The KaiC protein can be phosphorylated (a phosphate group co-valiantly linked). Mutations of the site of phosphorylation can abolish the circadian rhythym (Xu et al. 2004). Tomita et al. (2004) measured phosphorylation levels of cells kept in the dark and found that it oscillated with a period of about 24 hours regardless of whether the temperature was 25, 30, or 30C.
It was known that KaiC could phosphorylate itself, but that the rate was much higher in the presence of KaiA. Tomita then studied in vitro systems consisting of purified KaiC and KaiA or just KaiC, along with ATP (the source of phosphates), a buffer and salts. Initially about 0.4 of the phosphoryation sites on the purified KaiC were phosphorylated. For KaiC alone It was found that the level of phosphorylation increased slightly in the first 30 minutes, then decreased steadily for the remainder of a 6 hour period, and the rate of decrease was the similar at the three temperatures(top part of figure at right). When KaiA was also present, the phorphorylation increased steadily, reaching about 0.8, again at the about the same rate at the three temperatures.
Tomita presented the model at right to explain how the phosphorylation cycle of KaiC could be maintained in the dark without requiring continuing transcription and translation. Binding of KaiA to KaiC would cause phosphorylation of KaiC. This would continue until KaiB limited this activity. At this point phosphorylated KaiC would start to de-phosphorylate. They attributed the subsequent reinitiation of phosphorylation to some unknown process related to changes in the internal state of KaiC dependent on the level of phosphorylation.
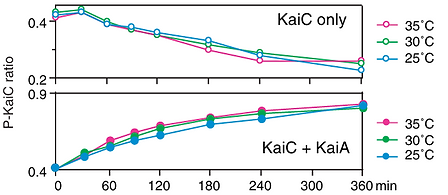

Figure 3d of Tomita et al. (2004)
Figure 4 of Tomita et al. (2004)
van Zon et al. (2007) were interested in building a model that would qualitatively explain the phosphorylation changes observed by Tomita based on different possible states of the KaiC. It was known that KaiC has two sites at which it could be phosphorylated, but they chose to assume one site.
Also in 2007, two papers were published(Nishiwaki et al. (2007) and Rust et al. (2007)) that presented evidence that sequential phosphorylation of both sites and subsequent dephosphorylation of both sites is a requirement for oscillation. Neither paper considered the allosteric changes discussed below. I think the best current understanding of KaiC cycling comes from the recent understanding of the 3D structures of the hexamer (see below) at different stages of the cycle using x-ray crystallography (Furuike et al. 2022). However, I don't know of any work since Daniels et al. (2008) which have addressed how the various reaction rates between the stages results in temperature compensation.
The KaiC protein can shift back and forth between two different shapes, which are called allosteric changes.
They then made assumptions about the free energy levels of KaiC monomer. In the figure below I show a rearrangement of their Figure 1A. In the original figure they showed the relative free energy levels among the unphosphorylated states and below that the relative free energy levels among the phosphorylated states. I, think that their placement could lead to confusion as the relative energy levels between unphosphorylated states that was clear in their verbal description of their model. So I moved the part with the phosphorylated states up and to the right. Generally, the transition to a lower energy level is the favored direction, the addition of energy is required for transition to a higher energy level.
On the left side are shown the unphosphorylated monomer (A), which they assume is the active configuration, i.e. in a state where it can participate in activating certain genes. A can readily change shape into an inactive configuration (I), since they assumed A and I have approximately the same (free) energy. In going from one state to the other, the protein has to go through an intermediate state at a higher energy. The rate that this occurs depends, among other things, on the concentration of the initial state and the difference in energy between the initial state and the intermediate state (the activation energy), being slower the higher the activation energy and faster as the temperature rises. They also assumed that in the unphosphorylated state, KaiC can bind (non-covalently) to an ATP molecule, but this raises the energy in the I state but lowers the energy in the A state. If these were the only possible states, if ATP is present in sufficient quantity, whatever the initial conditions, after enough time the highest concentration will be the A-ATP state, with progressively lesser amounts, in the A, I, and I-ATP states.


The A-ATP state can be converted to the much higher energy state Ap-ADP because of the high (latent) energy in the phosphate to phosphate bond in ATP. They assume that with a covalently attached phosphate and a non-covalently attached ADP conversions between the active form and the inactive form occurs readily, but that release of the ADP is energetically favored in the inactive form, but is disfavored in the active form.
The following cyclic behavior is now possible with this simple model: A → A-ATP → Ap-ADP→ Ip-ADP → Ip → I → A. As part of the larger circadian system, light could induce production of new (unphosphorylated) KaiC molecules to kickstart the system in the morning. The 24-hour oscillation in the dark could continue with enough ATP and the right set of reaction rates.
van Zon next dealt with a further complication. In vivo, the KaiC protein is found as an aggregate of six monomers (a hexamer). So, instead of 8 states in their monomer model, there might be many more. The energy levels of each monomer might depend on whether its neighbors were phosphoryylated or not. However, they ignored some of these possibilities by assuming KaiC acts according to the MWC model, which was first formulated by Monod, Wyman, and Changeux (1965).
The MWC model states that for proteins that can undergo a confirmation change, when they are in aggregates of the same monomer, they must all undergo the change in configuration at the same time because the energy levels of aggregates with other combinations of the two configurations are too high.
Changeux was a student in Monod's laboratory when he discovered one of the first two examples of an allosteric change in a protein that regulated a metabolic pathway. Monod shared the Nobel Prize in medicine in 1965 for his work on the metabolism of lactose in the bacteria E. coli, including the discovery of the first example of a protein that controls gene expression by binding to DNA, the lactose repressor. It would be a waste of energy for the bacteria to produce proteins used to metabolize lactose if it is not present. Monod, Changeux, and Jacob (1963) proposed that the lactose repressor, which exists as a dimer, binds to DNA near the genes involved in lactose metabolism, and prevents RNA polymerase from transcribing these genes in messenger RNAs. Binding of lactose to a site different from the DNA-binding site would induce confirmational change in the lactose repressor dimer to a form that no longer could bind to DNA, turning on expression of the lactose genes.
The figure at right shows their model where changes is phosphorylation will depend on the rates of transitions between14 different states that the KaiC hexamer can be in, active or inactive, with from 0 to 6 phosphates. Note that the figure is truncated in that it leaves out the hexamer states with between 2 and 6 phosphates. Phosphorylation can only occur in the active state and dephosphorylation on only in the active state, as in the simple monomer model. In the arrow for phosphorylation is larger than the one for dephosphorylation, indicating a greater effect. They postulate that this is the case if the KaiA protein is present, but if only KaiC is present the phosphoryoation rate is slower. Assuming that MWC applies, most of the transitions from active to inactive hexamers occurswith 6 phosphates with a rate f6, and from inactive to active occurs in hexamers with no phosphates (rate b0).

Figure 1B of van Zon et al.
This model can be used to crudely understand the behavior observed in the top panel above when ATP is added to purified KaiC. Since in the I state the monomers spontaneously dephosphorylate, after purification any phoshorylated monomers are likely to be in the active form. Once ATP is added, phosphorylation level may increase for a while, but once some of the active hexamers are completely phosphorylated, they are readily converted to the inactive form where they dephosphorylate faster than active forms are being newly phosphorylated, and phosphorylation levels start to decrease.
When KaiA is added along with ATP, KaiC phosphorylation occurs much faster. Starting at a phosphorylation level of 0.4, phosphorylation levels reaches a level of about 0.8 after 6 hours. Oscillatory behavior occurs when this system is observed for longer periods. Once most of the hexamers are in the active form with high levels of phosphorylation, there are fewer remaining sites to be phosphorylated, and now more completely phosphorylated hexamers convert to the inactive form and start being dephosphorylated, and phosphorylation levels drop, only to start increasing again when large numbers of hexamers reach 0 phosphates, convert to the active form and the cycle starts again.
However, there were several problems with this model. The reactions rates are the average rate for a large number of molecules. But for each individual hexamer, each transition is a random event, i.e., occurring only when the molecular vibrations concentrate enough energy to overcome the activation barrier. When this individual molecule model was simulated, the phosphorylation of a single hexamer oscillated with a varying period and amplitude. When the simulation was run many times and the phosphorylation levels summed, there was no longer any oscillation. The current model lacked any mechanism to synchronize the oscillation of individual hexamers.
They were able to achieve synchronization by assuming that the binding KaiA to KaiC decreases with increasing phosphorylation of the hexamer. Thus, for hexamers with more phosphates than average, subsequent phosphorylation occurs more slowly than average while those with less occur more rapidly.